ABOUT ME
Hi there! I'm Kamal, a B.Tech (CSE) student at NSHM College of Engineering & Technology, specializing in Data Analytics. I focus on Python, SQL, Excel, and Power BI, combined with strong knowledge of Statistics and Data Visualization, to turn raw data into actionable business insights.
II'm a passionate Data Analyst. My journey in tech began with a curiosity about uncovering patterns hidden in data, which led me to dive deep into SQL, BI tools, Python, Statistics, and Excel to transform raw data into actionable insights.

A selection of my most recent and impactful work, showcasing my expertise in web development, design, and problem-solving.
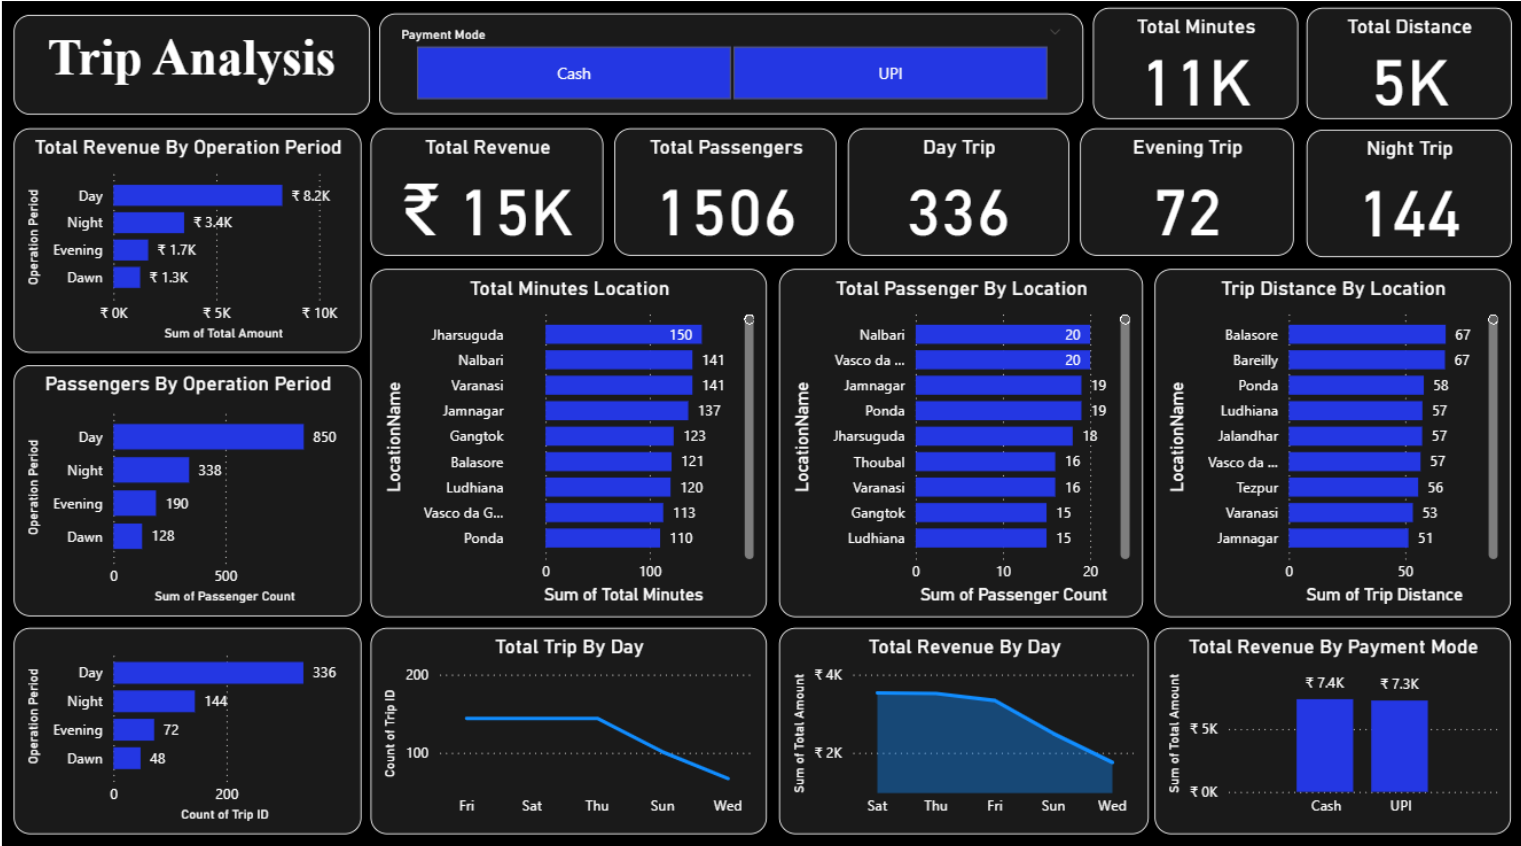
An interactive Trip Analysis Dashboard built in Power BI to monitor revenue, passenger
behavior,
and operational efficiency. It provides real-time insights into trip performance by time
period,
payment mode, and location, helping stakeholders identify patterns and optimize
operations.
Key KPIs: Total Revenue, Passengers, Trip Minutes,
Distance Covered,
Payment Mode, Location Performance
Power BI, Power Query, DAX, Data Modeling, Data Visualization.
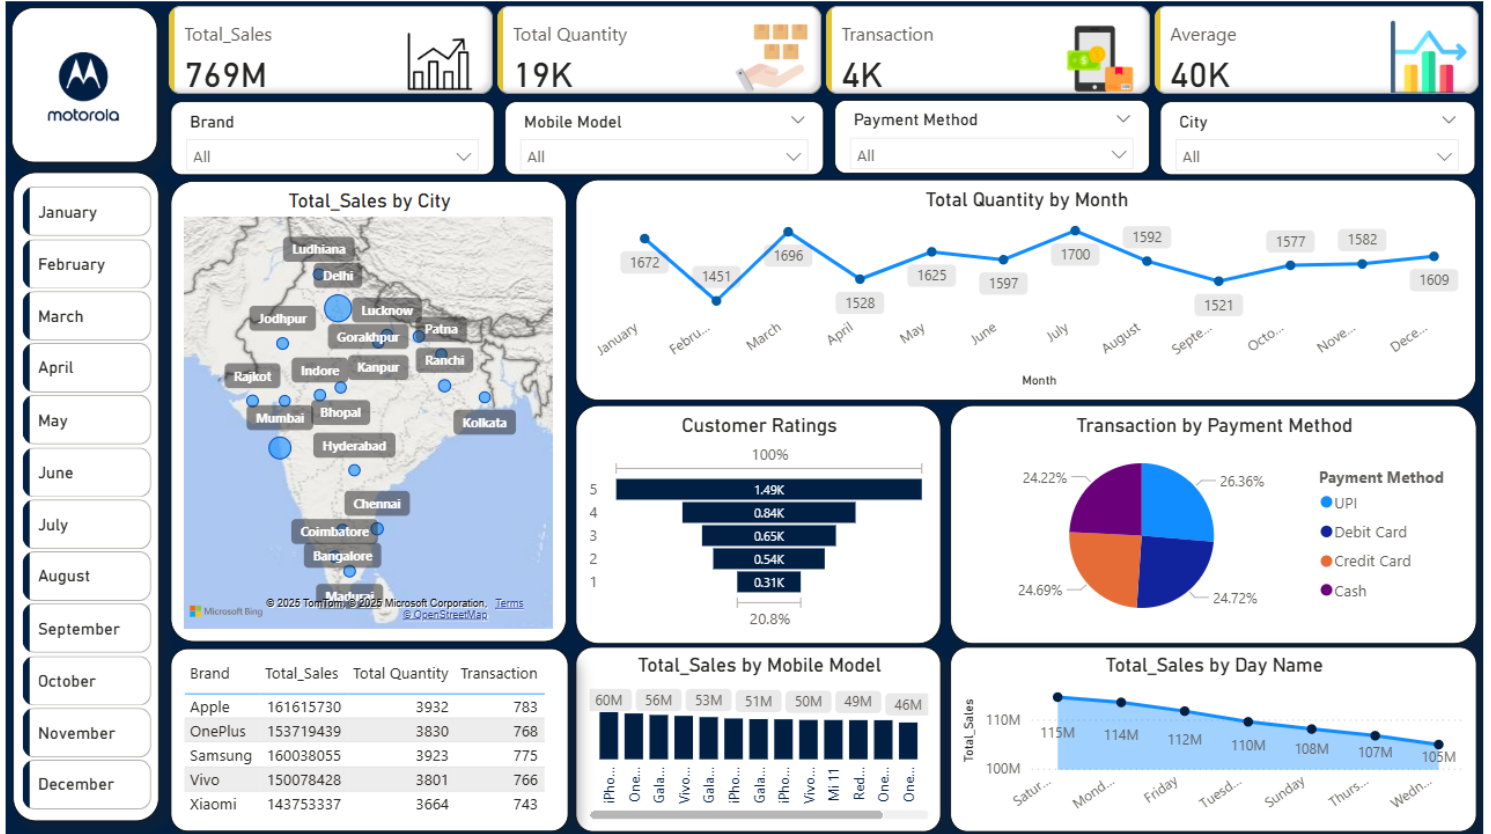
An interactive Mobile Sales Analytics Dashboard built in Power BI to track sales,
quantity,
transactions, ratings, and payment behavior across brands, models, and cities. Data
cleaning
was done in Power Query and KPIs were calculated using DAX for actionable insights on
performance, seasonality, and customer sentiment.
Key KPIs: Total Sales, Quantity Sold, Transactions,
Avg. Sales/Transaction, Payment Share, Brand & Model Ranking, Customer Ratings
Power BI, Power Query, DAX, Data Modeling
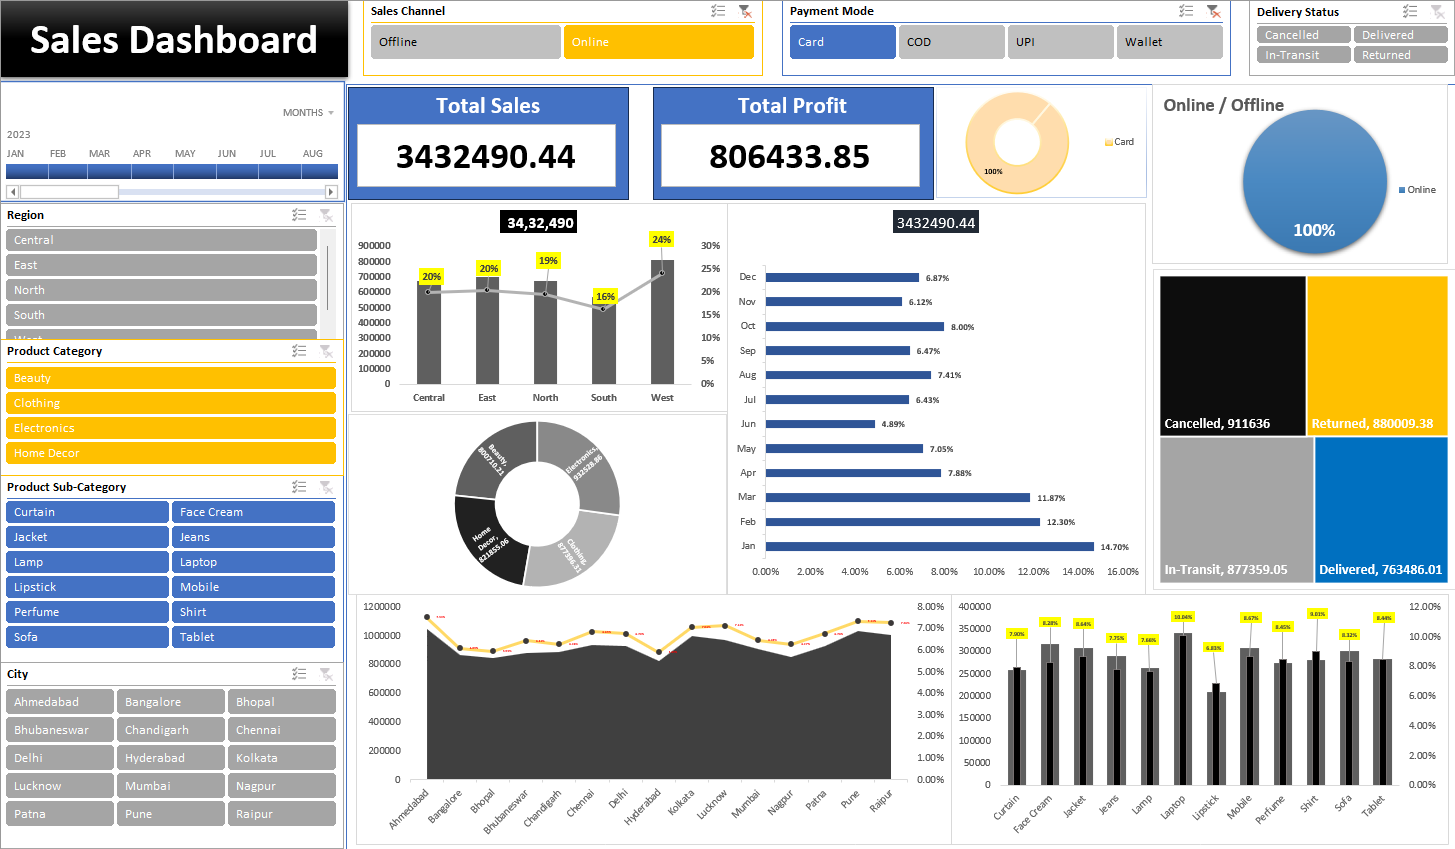
An interactive Business Insight Dashboard built in Microsoft Excel using pivot tables,
slicers, and
charts to track revenue trends, product performance, customer segments, and regional
sales.
The dashboard helps identify key growth areas and supports better business
decision-making.
Key KPIs: Total Sales, Profit Margin, Top Products,
Regional Revenue
Microsoft Excel, Pivot Tables, Slicers, Charts, Data Cleaning
Final year
Grade: First Class Distinction
Have a project in mind or want to collaborate? Feel free to reach out using the form below or through my social media channels.
Your message has been sent successfully! I'll get back to you soon.